Cost-efficient procurement of bridge infrastructures through incorporating LCCA with BMSs
Case Study
The Karlsnäs Bridge (approximate total length 320 m and total width 22.5 m) is intended to carry average daily traffic (ADT) of 10,000 vehicles in four traffic-lanes (two in each direction), with a pedestrian lane on each side. The Swedish Transport Administration (Trafikverket) is an authority and by law must endeavor to procure goods, services and contracts in competition (Konkurrensverket 2012). Trafikverket was initially intended to procure this bridge through a traditional fixed-design approach. Hence, Proposal 1 (see Figure 3 for its cross-section and layout) has been prepared by a consultant contracted by Trafikverket for consideration as the conceptual design in the tender documents. However, considering the analysis below, Trafikverket has decided to procure this bridge through a D-B tendering process. The following sections describe an investigation of the conceptual design’s cost-efficiency and how the bridge is procured through LCC Added-Value analysis under D-B tender process.
Step 1: Exploration of technically feasible bridge types, their layouts and anticipated INV costs
The WebHybris tool was used to search for modern existing bridges registered in BaTMan longer than 200 m with spans greater than 40 m and 113 were found: 50 concrete bridges and 63 steel-concrete composite bridges. Based on this information, another four proposals were considered technically feasible. Figure 3 presents Trafikverket’s conceptual design for the Karlsnäs Bridge and the other technically feasible proposals. The possible span numbers and span lengths for the four proposals were established from statistical analysis of data pertaining to similar bridges. The bridge cross-sections presented in Figure 3 are related to existing bridges in BaTMan with different dimensions.
The bridge types described in Proposals 1, 2, and 3 are the most common in similar locations to the Karlsnäs bridge. Those described in Proposals 4 and 5 might be more difficult to construct, and there may be a considerable risk of concrete cracking due to their large width. Furthermore, the superstructure of Proposal 5 might be too deep to provide the 6 m free space needed for a roadway under the bridge near an abutment.
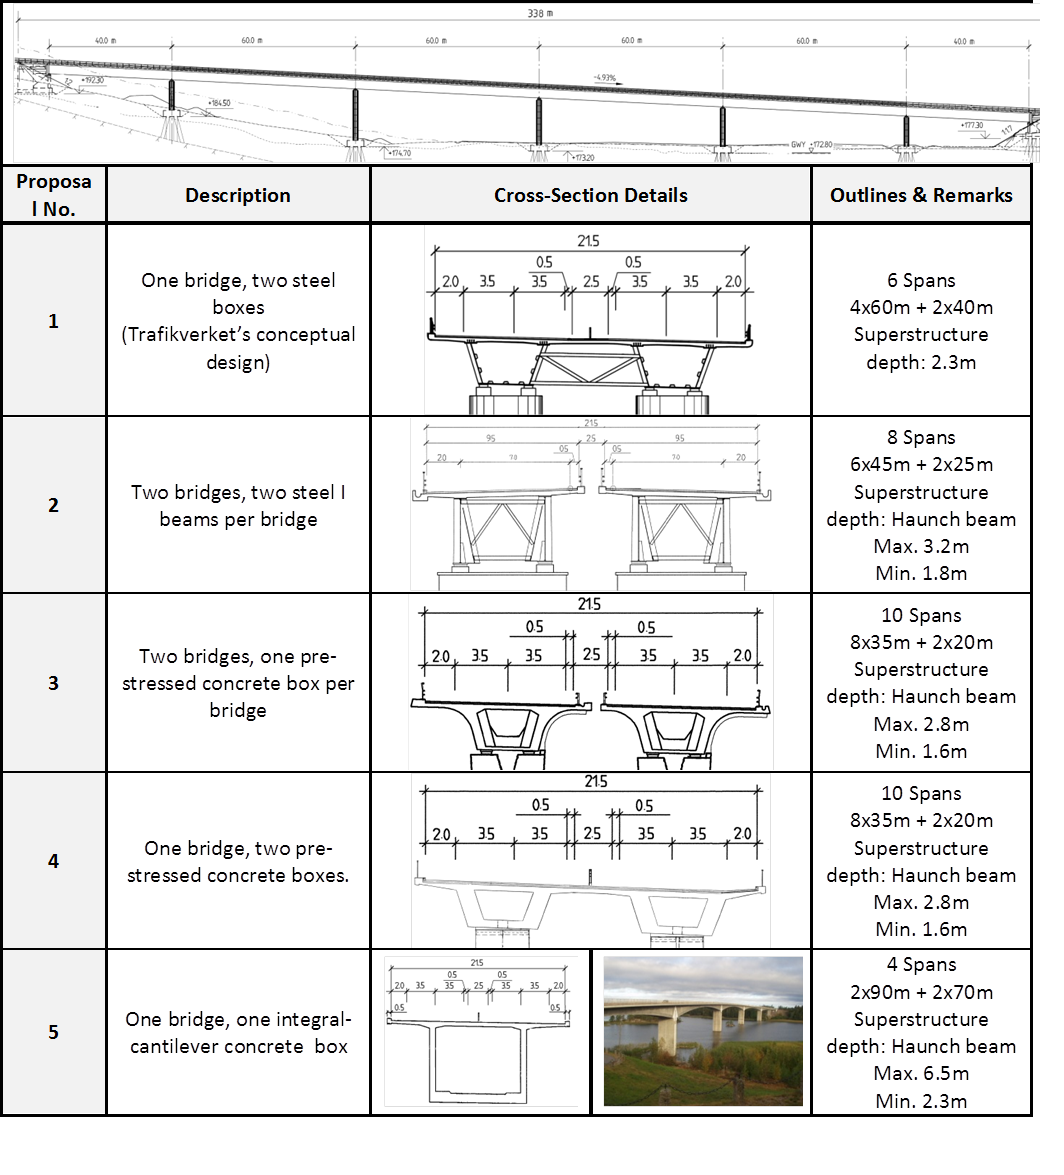
Figure 3. Technically feasible proposals and their outlines
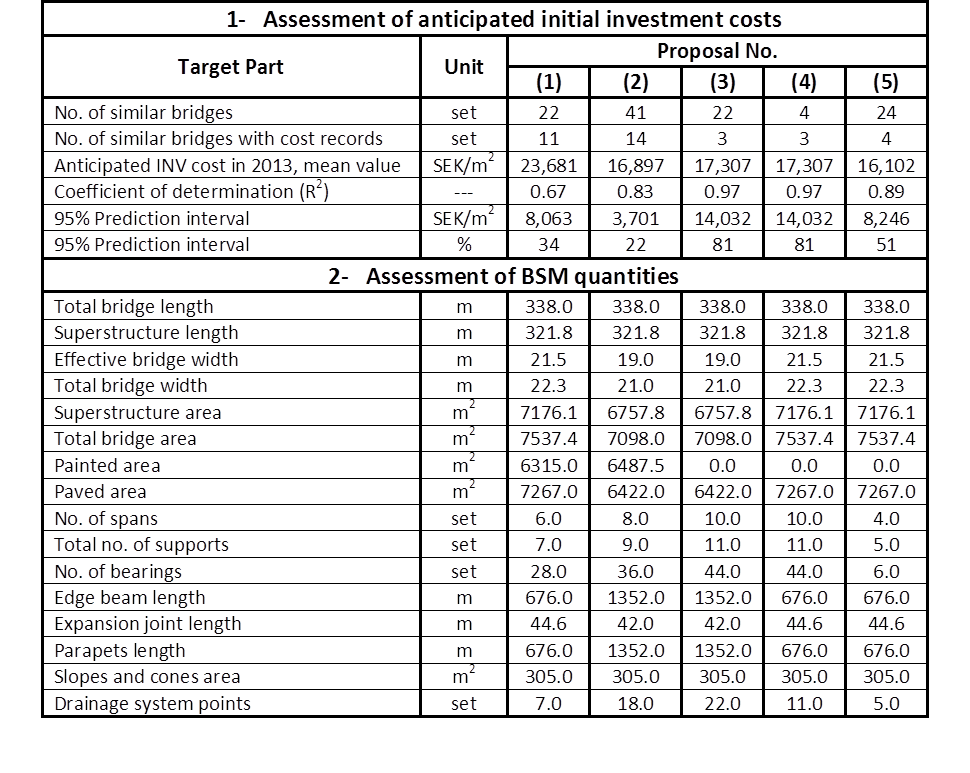
In early investment phases accurately assessing INV costs of the proposals might be difficult, while actual INV costs will be offered by the contractors. However, the uncertainty in assessment of the proposals’ INV costs will not affect the LCC benchmarks in this case study since the same lifespan will be considered for all proposals presented in Figure 3. Among the 113 similar bridges, only 35 were found to have registered cost records in BaTMan. The upper section of Table 1 presents numbers of similar existing bridges and the anticipated INV cost for each proposal in 2013. Least squares and prediction interval regression were applied to forecast the INV costs of each proposed design. The coefficients of determination for Proposals 3, 4 and 5 are greater than those for Proposals 1 and 2, but their 95% confidence intervals are also wider (Table 1). This is because of the limited degree of freedom due to the limited numbers of data points for Proposals 3, 4 and 5. Although the 95% prediction intervals are substantial, this will not affect final LCC benchmarks, since the INV cost will not be included in calculation of the LCC added-values, see equation (2). Thus, the anticipated mean values will be considered in the preliminarily comparison in step 4. However, it is highly important for Trafikverket to improve the accuracy of cost records related to the existing bridges registered in BaTMan and register cost data for all new bridges.
Table 1. The proposals’ initial investment costs and associated target quantities
Step 2: Quantification of the proposals’ BSMs
The BSMs and elements that would require LCMs during the lifespan of each proposed bridge are also listed in Table 1. The approximate quantity of each BSM required for each proposal was assessed based on an intensive review of drawings of similar bridges in BaTMan. These quantities are preliminary. Therefore, contractors are requested to supplement their bids with more precise BOQs for their respective proposals.
Step 3: Construction of a life-cycle plan for each proposal
Bridges similar to the Karlsnäs Bridge normally have a designed service lifespan of 100 years (Mattsson and Sundquist 2007). Therefore, this lifespan was considered for all the proposals presented in Figure 3. A LCP for a BSM identifies the LCMs that might be required to be performed on that BSM to maintain its function and thus ensure that a bridge incorporating it remains serviceable during its design service life-span. The bridges in BaTMan are broken down into 14 BSMs (Trafikverket 1996). Different bridge types have different numbers and quantities of those BSMs. Trafikverket annually publishes a price list stating the all actions applied to each type of BSM and associated average unit costs. Among 578 LCMs included in those lists, Table 2 presents the major LCMs performed on similar beam bridges, with unit costs based on the 2013 price list. The fixed costs are quantity-independent and mainly related to the establishment and traffic control costs prior to implementation of the LCMs.
Table 2. Major life-cycle measures applied to beam bridges in Sweden
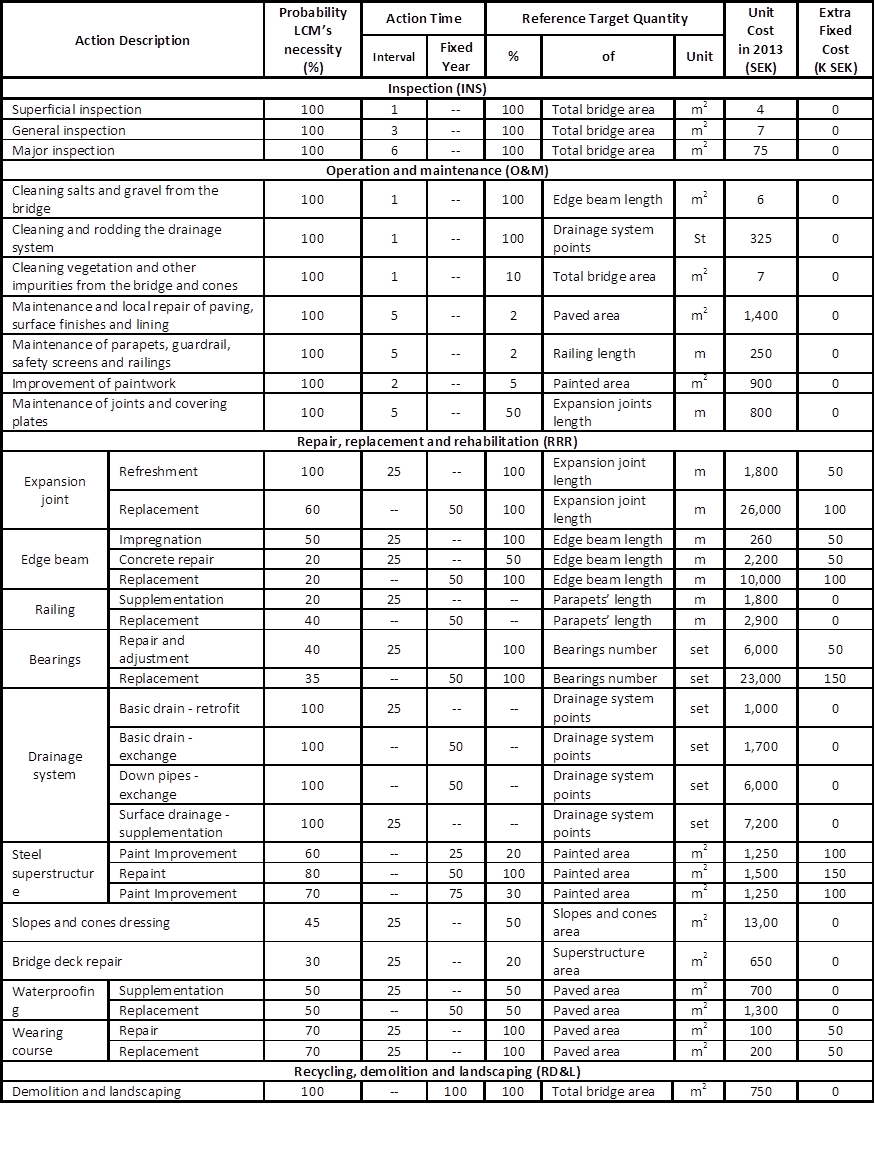
The RRR actions are the largest contributors to total LCM costs. The need for these types of actions is highly dependent on numerous variables, including the bridge type, design details, location, type and quality of its BSMs, and environmental conditions. In Table 2 a fixed time type means that the action should be performed once at a specific time while interval type means that the action should be performed at specified time intervals during the bridge’s life-span. The probability of a LCM’s necessity refers to the likelihood that it will be required. Thus, the NPV of a LCM equals to present values of that LCM multiplied by its necessity probability. The actions’ times and necessity probabilities in Table 2 are based on regression analysis and analysis of variance of intensive historical data related to similar actions performed on BSMs composed on similar bridges extracted from BaTMan using the Webhybris tool, taking into account their locations, design details and ADT volumes. Similar bridges having different designs details, under different conditions or carrying different ADT volumes might require different LCMs, times and costs. Intensive RRR records related to all BSMs comprising all bridges constructed in Sweden after 1950 were collected and analyzed. Detailed information about the analyses of those records and the recommended LCPs of the various BSMs comprising new Swedish bridges are presented by Safi (2013).
It is important to acknowledge that the LCPs are inherently uncertain and do not necessarily represent the actual LCMs that will be implemented during the life-cycle of new bridges. In addition, new BSMs designed to meet new standards may have greater durability than old BSMs. Thus, the LCMs performed on old BSMs might not necessarily be needed for new BSMs. However, that uncertainty will not significantly affect the analysis results considering the proposed procurement approach, partly because the NPV of LCMs cost is a small portion of the total LCC as it will be highlighted in the analysis below, and LCPs are applied to BSMs or target-quantities regardless the type of the proposals compressing them.
Step 4: LCCA and preliminary comparison of the proposals
The LCCA was conducted based on the proposals’ BOQs (Table 1) and LCMs presented in Table 2. Figure 4 shows the proposals’ anticipated INV costs and NPVs of their LCM costs at real discount rates of 2% and 4% (left y axis), together with results of a sensitivity analysis addressing the impact of varying the real discount rate on their LCC-efficiency (total LCC NPV) indicated by the curves (right y axis and upper x axis). The proposals’ LCC shown in Figure 4 and the below comparisons are preliminary since they are based on uncertain INV costs.
Figure 4. Impact of varying the real discount rate on the proposals’ expected LCC
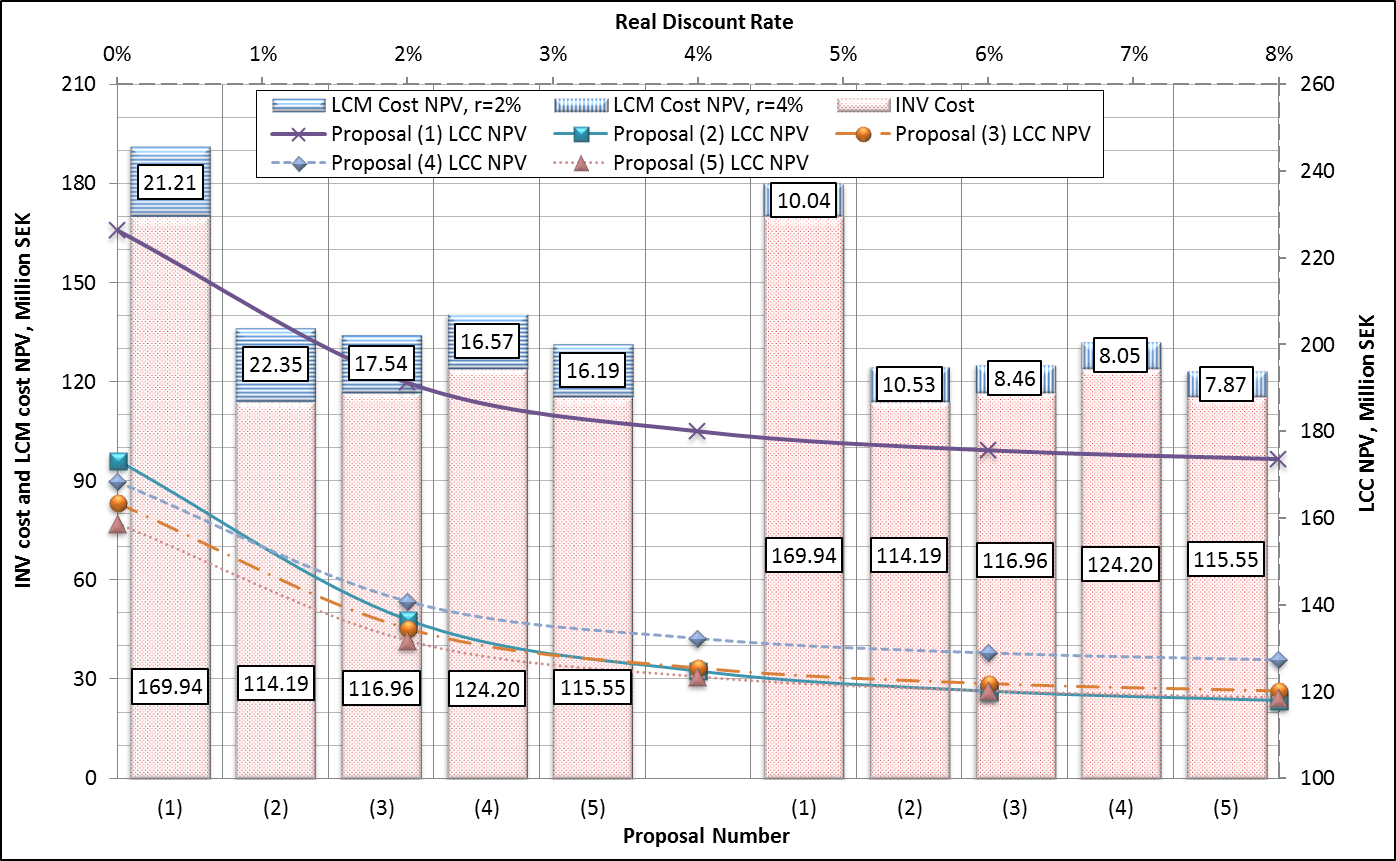
The presented data indicate that the most LCC-efficient proposal is expected to be Proposal 5 at a real discount rate less than 4% and Proposal 2 at a higher discount rate. Theoretically, applying a high discount rate will tend to favor investment alternatives with low INV costs, short lifespans and high LCM costs, and vice versa. A nominal discount rate of 4% should be considered in such LCCA according to Trafikverket’s 2013 rules. An intensive review of an array of Trafikverket’s annual price lists for the bridges’ LCM costs detected an average inflation rate of 2%, which should be included in the analysis. One way to do this is to consider the real costs of the LCMs at their implementation times rather than the present costs. The other practical way is to deduct the inflation rate from the discount rate. Thus, a real discount rate of 2% should be used in this context.
Regardless of the discount rate, Proposal 1 is expected to be the least LCC-efficient proposal (Figure 4). At a real discount rate of 2%, implementing Proposals 5 or 3 rather than Proposal 1 would yield a net saving (NS) of 59.4 or 56.6 million SEK, respectively, for a lifespan of 100 years. At a real discount rate of 2%, even though Proposal 2 offers a greater LCM cost NPV than Proposal 1, the anticipated NS yielded by implementing it rather than Proposal 1 is 54.6 million SEK for this service life. Based on the results shown in Figure 4 and LCCA of several other Swedish bridges, the proposals’ LCM costs generally represent 10% to 25% and 5% to 15% of their INV costs at real discount rates of 2% and 4%, respectively. However, the real LCM costs that would be incurred by procuring agencies could range from 50% to 120% of their INV costs.
Step 5: Interpolation of results and establishment of LCC-efficient benchmarks
Since the preliminary LCCA (step 4) showed that Proposal 5 is expected to be the most LCC-efficient at a 2% discount rate, Trafikverket could procure it through a traditional fixed-design approach. However, this procurement method is strongly not recommended. That approach may often result in selection of a sub-optimal design, for three main reasons. Firstly, the INV costs included in the preliminary LCCA analysis are considerably uncertain. Secondly, conceiving all the bridge designs that could provide feasible solutions in a given location is difficult, so the fixed design stated in the tender documents might not be the most cost-efficient. Thirdly, detailed drawings and specifications are required, which are costly, time-consuming and beyond the capability of many agencies to produce. Therefore, the method is to allow contractors to offer the designs they prefer as they satisfy the functional demands and design standard requirements, but incorporate each design with an LCC added-value.
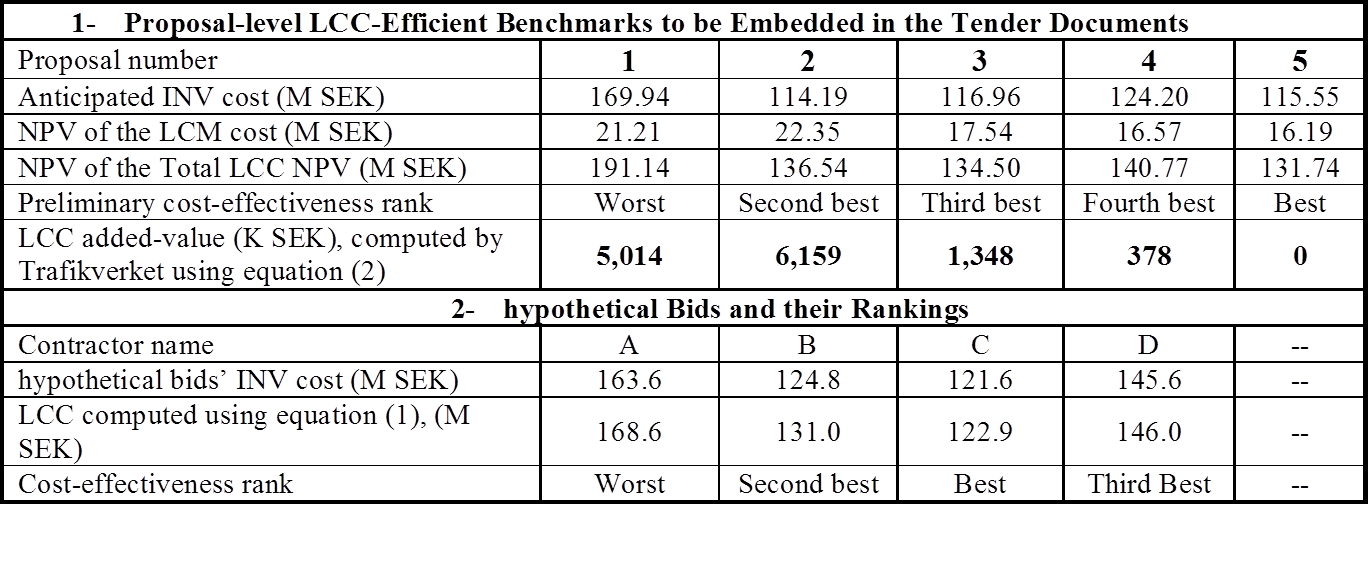
In this step two LCC-efficient benchmarks were computed: proposal-level and BSM-level LCC added-values. The proposals’ LCC added-values were based on a real discount rate of 2%. The proposals’ LCC added-values will only account for the LCM cost difference, since a lifespan of 100 years was assigned for all proposals. Thus, the uncertainty in the INV cost assessment will not affect the accuracy of LCC added-values since the second term of equation (2), which includes the anticipated INV cost of the reference proposal, will not be included in their computation. Since Proposal 5 is promoted in step 4, it is used as the reference proposal in step 5 for evaluating the other proposals’ LCC added-values. However, any of the proposals could be used as the reference design, but it is recommended to use the one promoted in step 4 to encourage contractors to prioritize it. The upper section of Table 3 presents the proposals’ preliminary LCC-effectiveness rankings and LCC added-values at a real discount rate of 2%, as computed by Trafikverket and stated in the tender documents.
Table 3. LCC added-values at a real discount rate of 2 % and hypothetical bid evaluation
Evaluation of hypothetical bids
The lower section of Table 3 presents hypothetical bids received from four contractors for four of the five proposals presented in Figure 3. The intention of this step is to illustrate how the bids should be evaluated using the new award criterion, expressed by equation (1). The preliminary LCC-effectiveness rankings in Table 3 identify Proposal 5 as the most LCC-effective. However, none of the contractors has offered this proposal, possibly because its real INV cost would be too high, it would not fulfill the functional requirements, would not be “technically feasible”, and/or contractors lack the knowledge or capability to construct the proposed design. Proposal 2 is the second most LCC-effective according to the rankings, but after excluding Proposal 5 from the competition, it is not deemed the most LCC-effective because its INV cost assumed in the hypothetical bids is higher than its anticipated INV cost. Consequently, Proposal 3 becomes the most LCC-effective and the contract should be awarded to contractor C to deliver it, with a total due sum of 121.6 million SEK.
Impact of varying the discount rate on the proposals’ LCC added-values
The proposals’ LCC added-values (computed relative to the most LCC-efficient proposal, i.e. Proposal 5 at discount rates less than 4% and Proposal 2 at higher rates) are significantly inversely related to the discount rate (Figure 5).
Figure 5. LCC added-values computed at indicated real discount rates (M SEK)
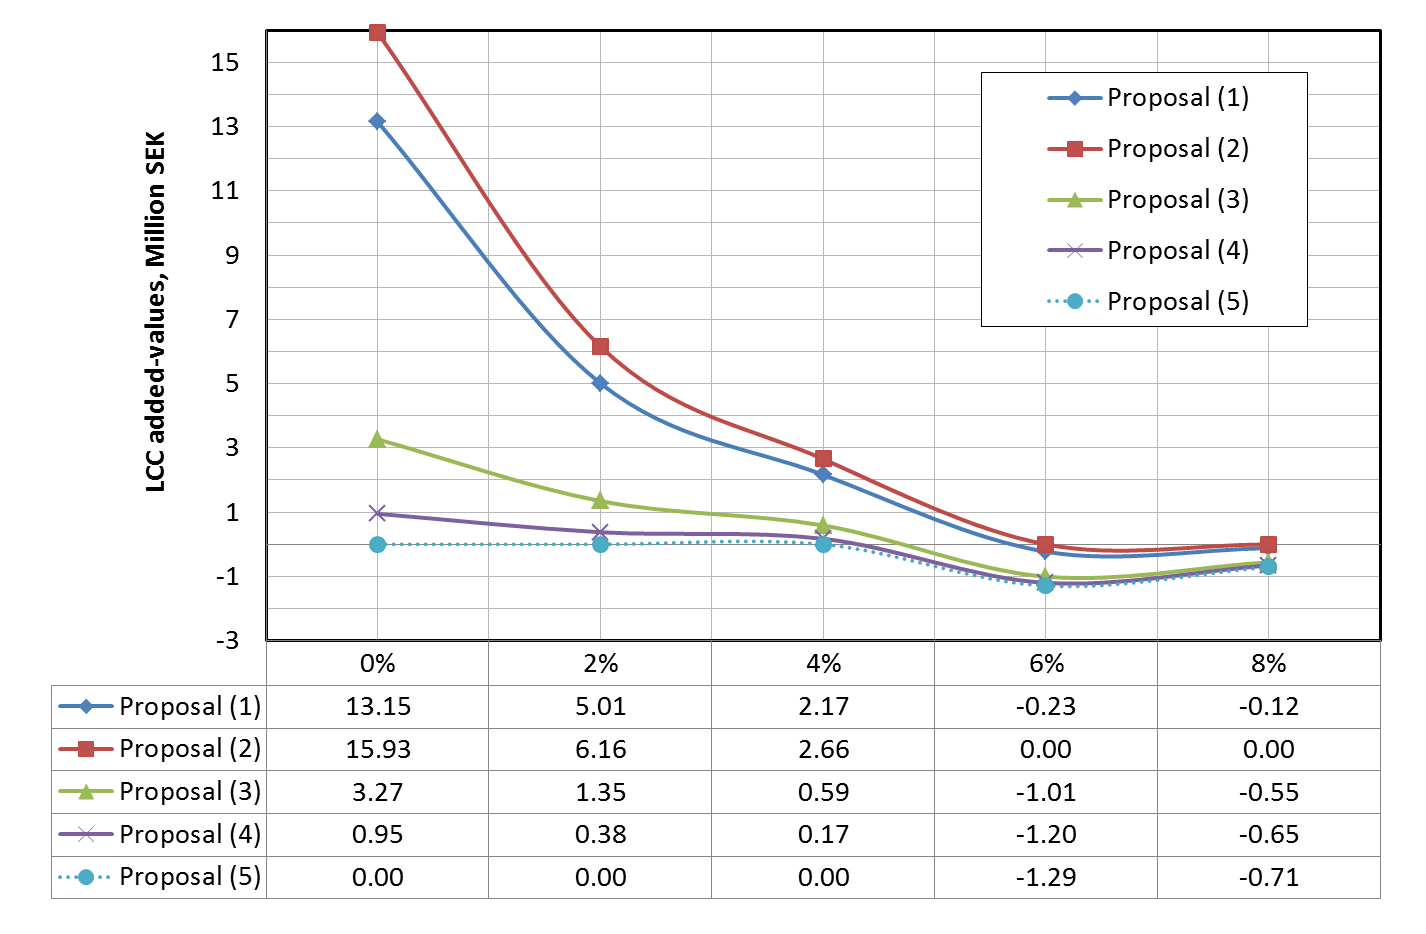
If (unusually) future funds are secured, agencies should use a discount rate equal to zero and include the inflation rate, but not otherwise. Although Proposal 2 is associated with the highest LCM costs (Figure 4), it becomes the most LCC-effective at discount rates of 6% and 8% (Figure 5). Consequently, the LCC added-values associated with all other proposals become negative. Due to the small LCM cost difference between Proposals 3, 4 and 5 (Figure 4), their LCC added value curves are almost identical at discount rate of 6% and 8% (Figure 5). The data in Figure 5 indicate that although varying the discount rate considerably affects the LCC added-values, it does not significantly affect the final decision. The proposals’ INV costs offered in the contractors’ bids remain the main parameter guiding the final decision. Correct choose of the reference proposal is important but not critical since the added-values are computed in a relative appraisal. However, that would be more important in a case where the feasible proposals could have unequal lifespan. The anticipated INV cost of the reference proposal will be included in computing the LCC added values in that case, see equation 2.
Structural-members’ LCC added-values
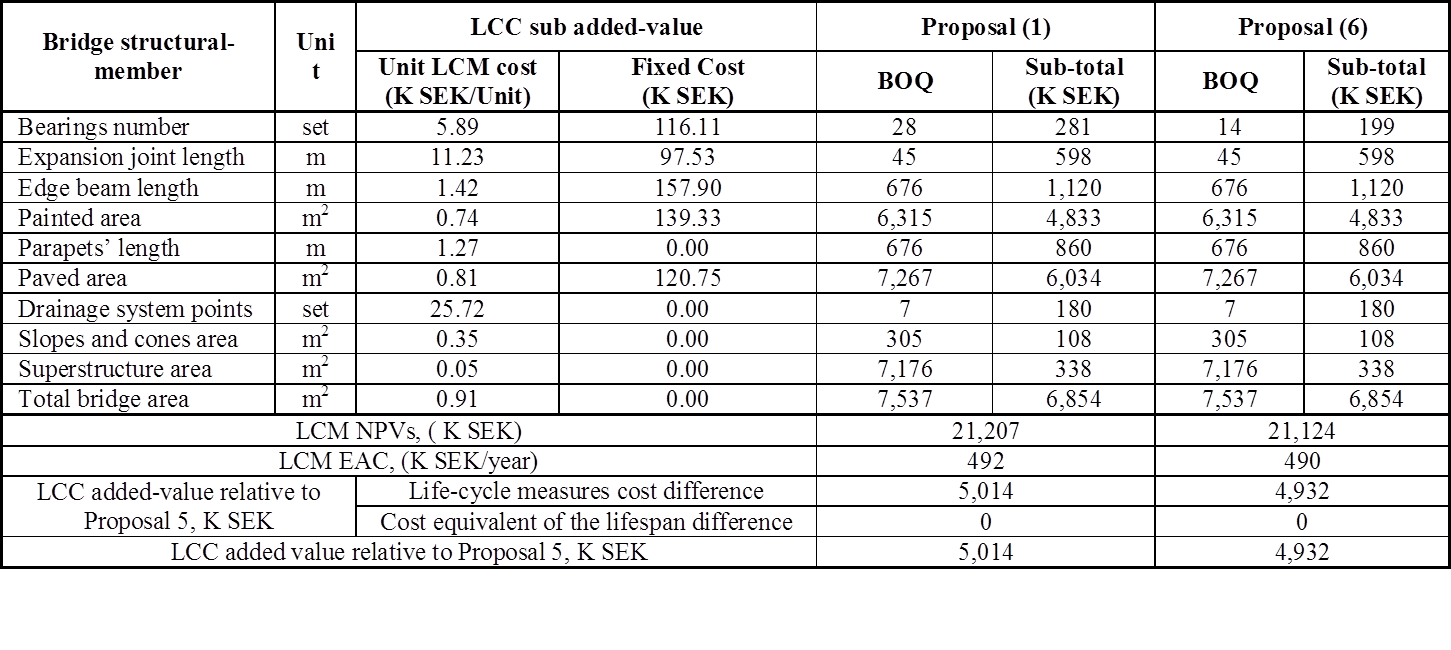
To maintain contractors’ freedom in D-B tendering processes and allow consideration of innovative designs, benchmark LCC added-values for structural members should also be formulated by agencies and included in the tender documents along with the proposals’ LCC added-values. An agency could determine the BSMs’ added-values by applying the LCPs presented in Table 2 to an artificial proposal consists of a measured-unit of the various target quantities presented on Table 1. Thus, the NPV of the LCM costs, which will be incurred by the agency to acquire a measured-unit of each target quantity during the lifespan of a bridge incorporating it, could be determined. Contractors could use those BSMs’ LCC added-values and equation (2) to compute the LCC added-values of their proposals after quantifying the BSMs comprising their designs. To allow this, the life-span, INV cost and LCM EAC of the reference design should be stated in the tender documents. The technical service lifespans of the various bridge types and discount rate used in the analysis should also be addressed by the bridge procurer. Contractors could first compute the NPVs of the LCM costs associated with their proposals by multiplying the BSMs’ added-values with the respective quantities required for their proposed designs. Hence, a proposal’s LCM cost EAC could be determined and the first term of equation (2) could then be estimated. If contractors intended to offer a design with a different technical service lifespan from that of the reference design, they could use the anticipated INV cost and lifespan of the reference proposal stated in the tender documents to determine the second term in equation (2).
In our case-study, assume a contractor wants to propose a different design, designated Proposal 6, similar to Proposal 1, but with one rather than two bearings per box. Again, a technical lifespan of 100 years is considered for this option. Table 4 presents the added-values associated with the various BSMs at a discount rate of 4%, as both unit and fixed costs. The fixed costs are quantity-independent. Table 4 also presents the LCC added-value computed by a contractor for Proposal 1 using the LCC added-values for the BSMs, which is equal to the added-value computed by Trafikverket for this proposal (Table 3). The LCC added-values presented at the bottom of Table 4 are computed relative to Proposal 5, used as the reference design in the tender documents. The LCM cost NPV of proposal 5 at a discount rate of 4% (16.19 million SEK, Figure 4) was used to compute the LCC added-values of Proposal 6 shown in Table 4.
Table 4. Structural-members’ LCC added-values at a discount rate of 4%
Actual bids’ evaluation
Trafikverket received bids from five contractors for the Karlsnäs Bridge in October 2012. The LCC added-values and BSM’s LCC added-values presented in Table 3 and Table 4, had been stated in the tender documents. All participating contractors offered a design similar to Proposal 3 and the contract was awarded to the lowest LCC bid, with an INV cost of 115.5 million SEK.


